 Slovenski INSPIRE metapodatkovni sistem
Keyword
energetski viri
3 record(s)
Type of resources
Categories
INSPIRE themes
Keywords
Formats
Representation types
Resolution
-
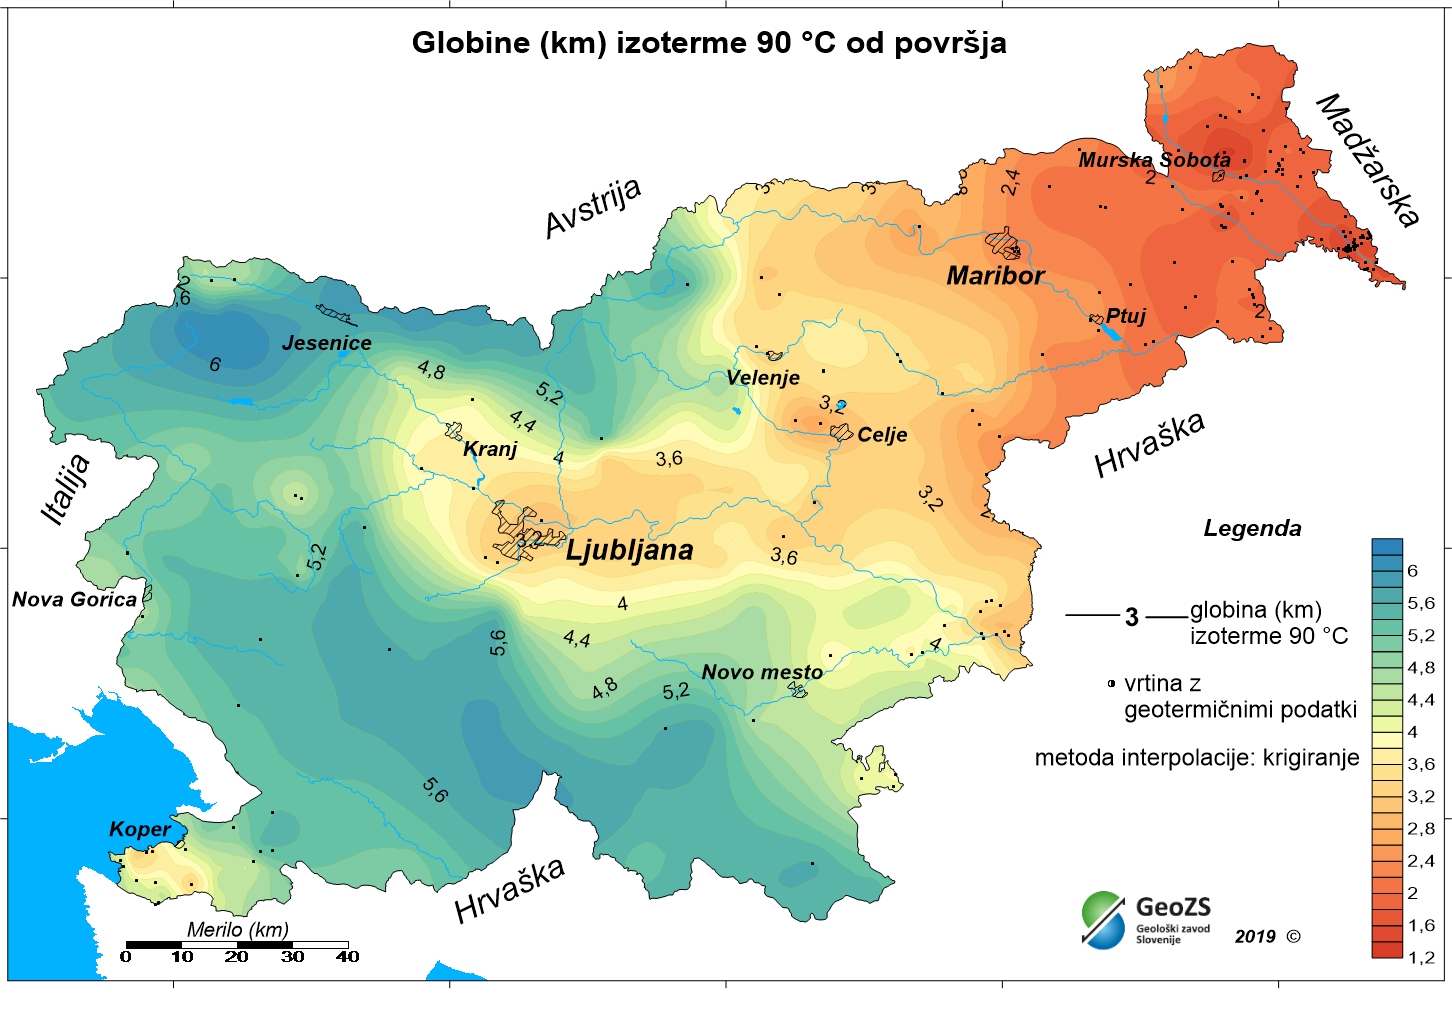
The underground geothermal conditions can be presented, irrespective of the aquifers' position, with the appropriate geothermal maps. This map shows the expected depths of the isotherm of 90 °C and is made with data from 191 boreholes. In a way, it is the inverse of those ordinary temperature maps showing the temperature at certain depths. It is made on the basis of measured temperatures in accessible boreholes throughout the country. However, since the temperature field depends on the geological structure in the depths and tectonic characteristics, the course contours result of many influences, such as thermal conductivity of rocks, permeability and fracturing of rocks, all of which are reflected in the measured temperatures in boreholes. The distribution of boreholes, which were useful for the measurement of temperature, is very uneven, and different as regard the depths. The map of depths to 90 °C isotherm shows a positive anomaly in the northeastern part of Slovenia. As a result of thin Earth's crust in the area and the higher conductive heat flow from the Earth's mantle, there are higher temperatures and thus are inversely smaller depths to isotherm of 90 °C.
-
Map represents the calculated (surface) heat-flow density (HFD) in mW/m2 with topographic correction. It is made with data from 119 boreholes from the measured temperatures in the available boreholes and measured thermal conductivity on cored rock samples from the same boreholes. The pattern of the HFD isolines is affected by numerous parameters, particularly the thermal conductivity of rocks, rock permeability and fracturing, fluid content of the rocks, and all are reflected in the measured temperature gradient in the boreholes.